Graphical User Interface (GUI)
af_analysis_gui provides a local web interface for browsing AlphaFold result sets loaded through af_analysis. The GUI combines a dataset table, a Mol* structure viewer, score plots, and clustering views so the same loaded dataset can be inspected without writing a notebook.
Overview
The GUI is implemented as a Flask application and is distributed as an optional extra:
pip install "af-analysis[gui]"
Launch it with the console entry point:
af_analysis_gui
or directly as a module:
python -m af_analysis_gui.flask_app
By default the server starts on http://127.0.0.1:5000. If the port is already in use, the application automatically tries the next available port.
Main Interface
The main page is split into three working areas:
A top toolbar for loading a dataset and opening the compute and clustering dialogs.
A dataset table that exposes identifier and score columns for every loaded model.
Two synchronized bottom panels: a Mol* viewer for structures and a plot panel for pLDDT, PAE, matrix scores, MDS scatter plots, and dendrograms.

Overview of the main af_analysis_gui workspace.
Typical Workflow
Open the load dialog and choose either a results directory or a previously exported CSV file.
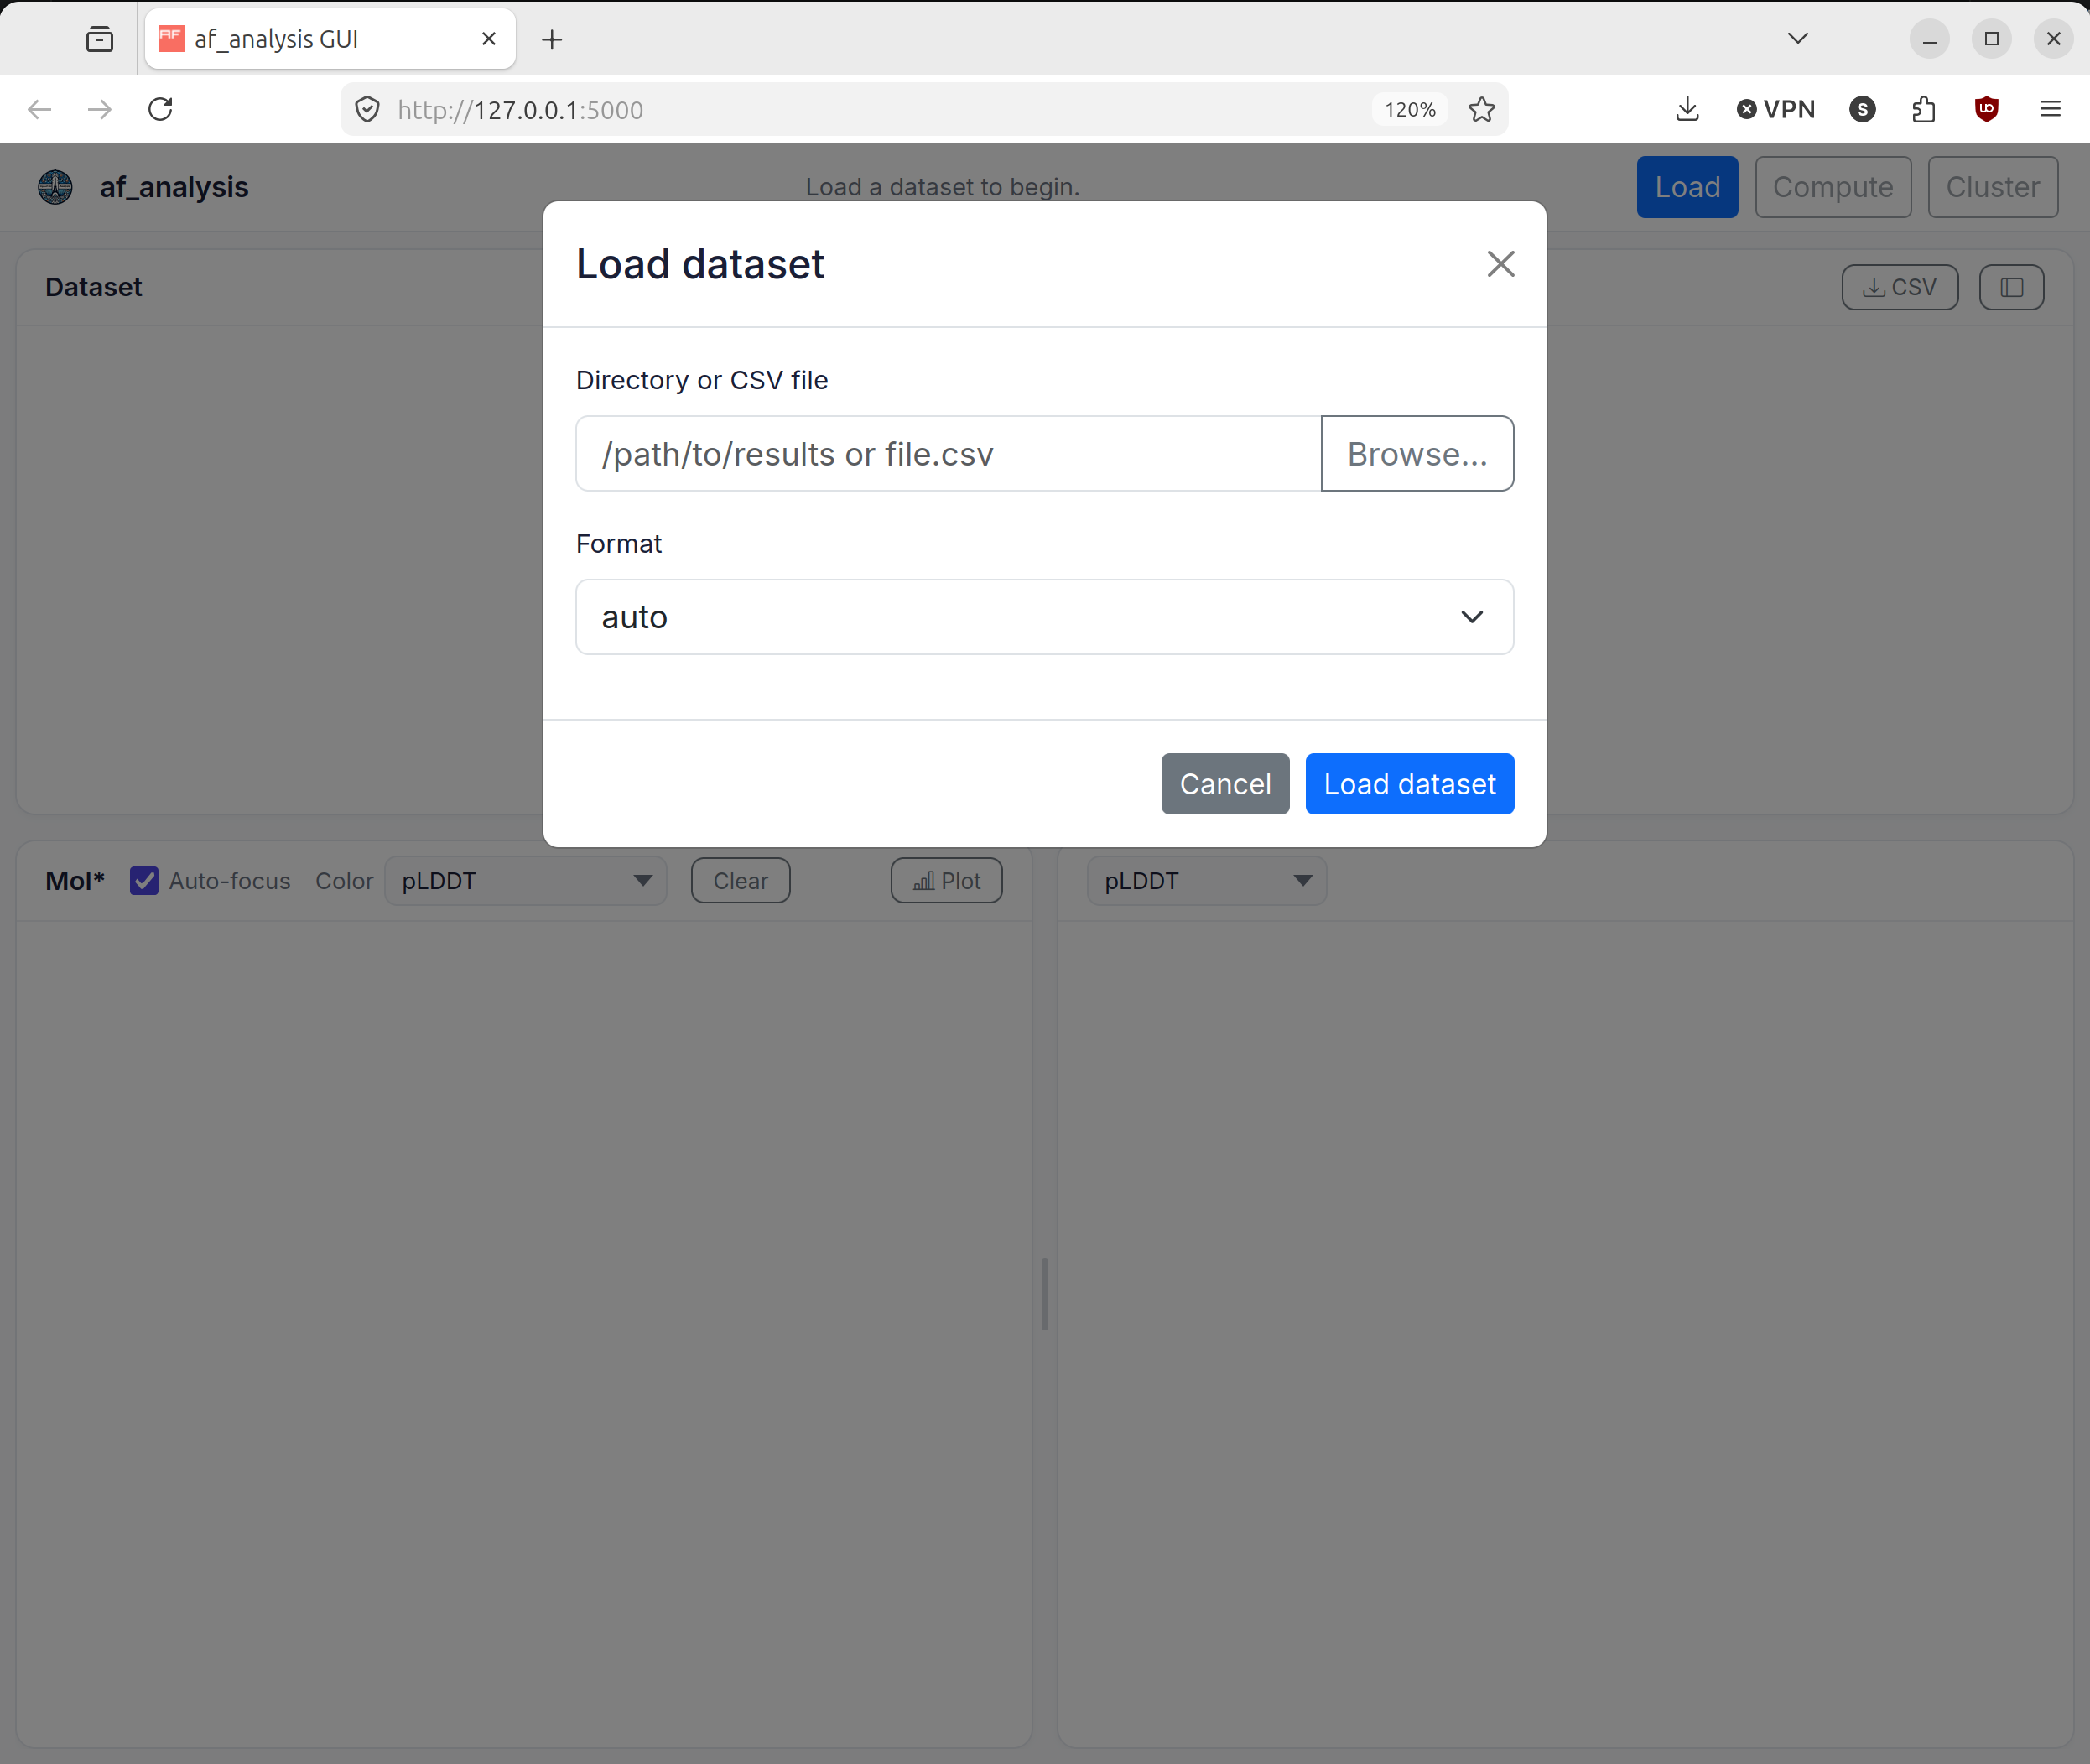
The load dialog used to open a results directory or CSV file.
You can browse the filesystem from the load dialog, or paste a path directly into the input field. The GUI accepts both directories and CSV files and tries to auto-detect the format. If auto-detection fails, select the appropriate format manually from the dropdown menu.
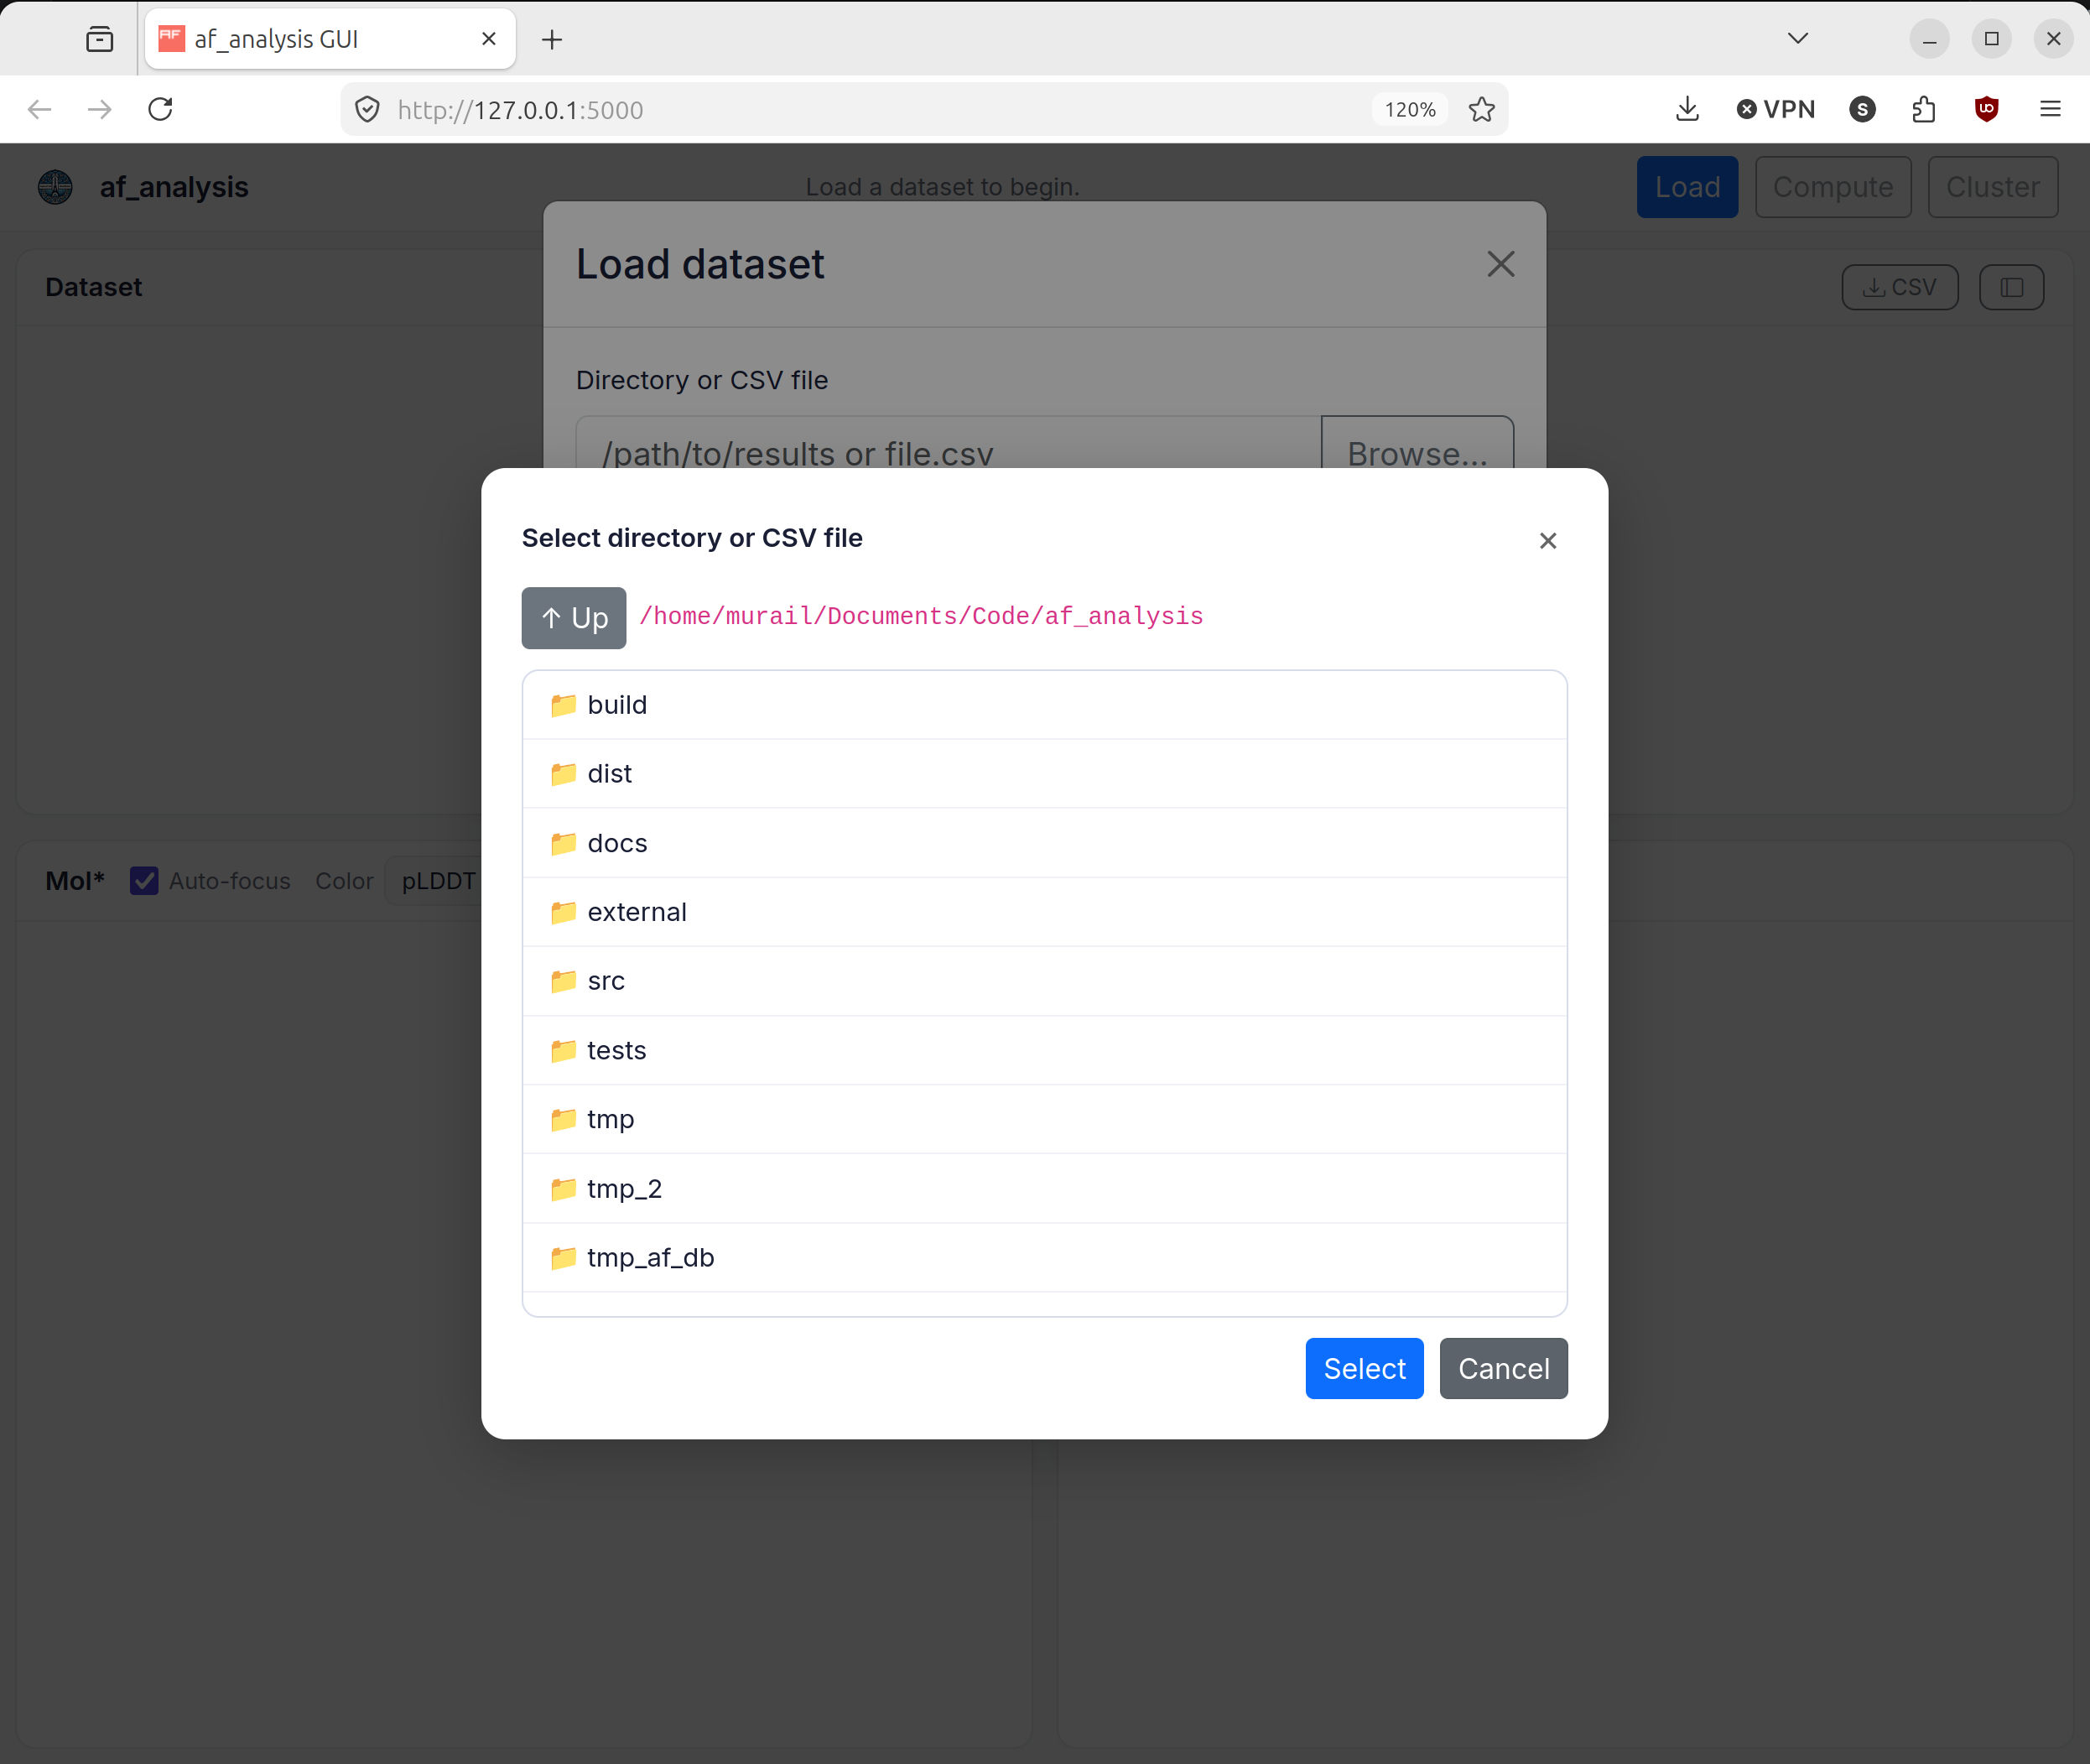
The built-in browser for selecting a results directory or CSV file.
After loading the dataset, inspect the table and click a row to update both the structure viewer and the plot panel.
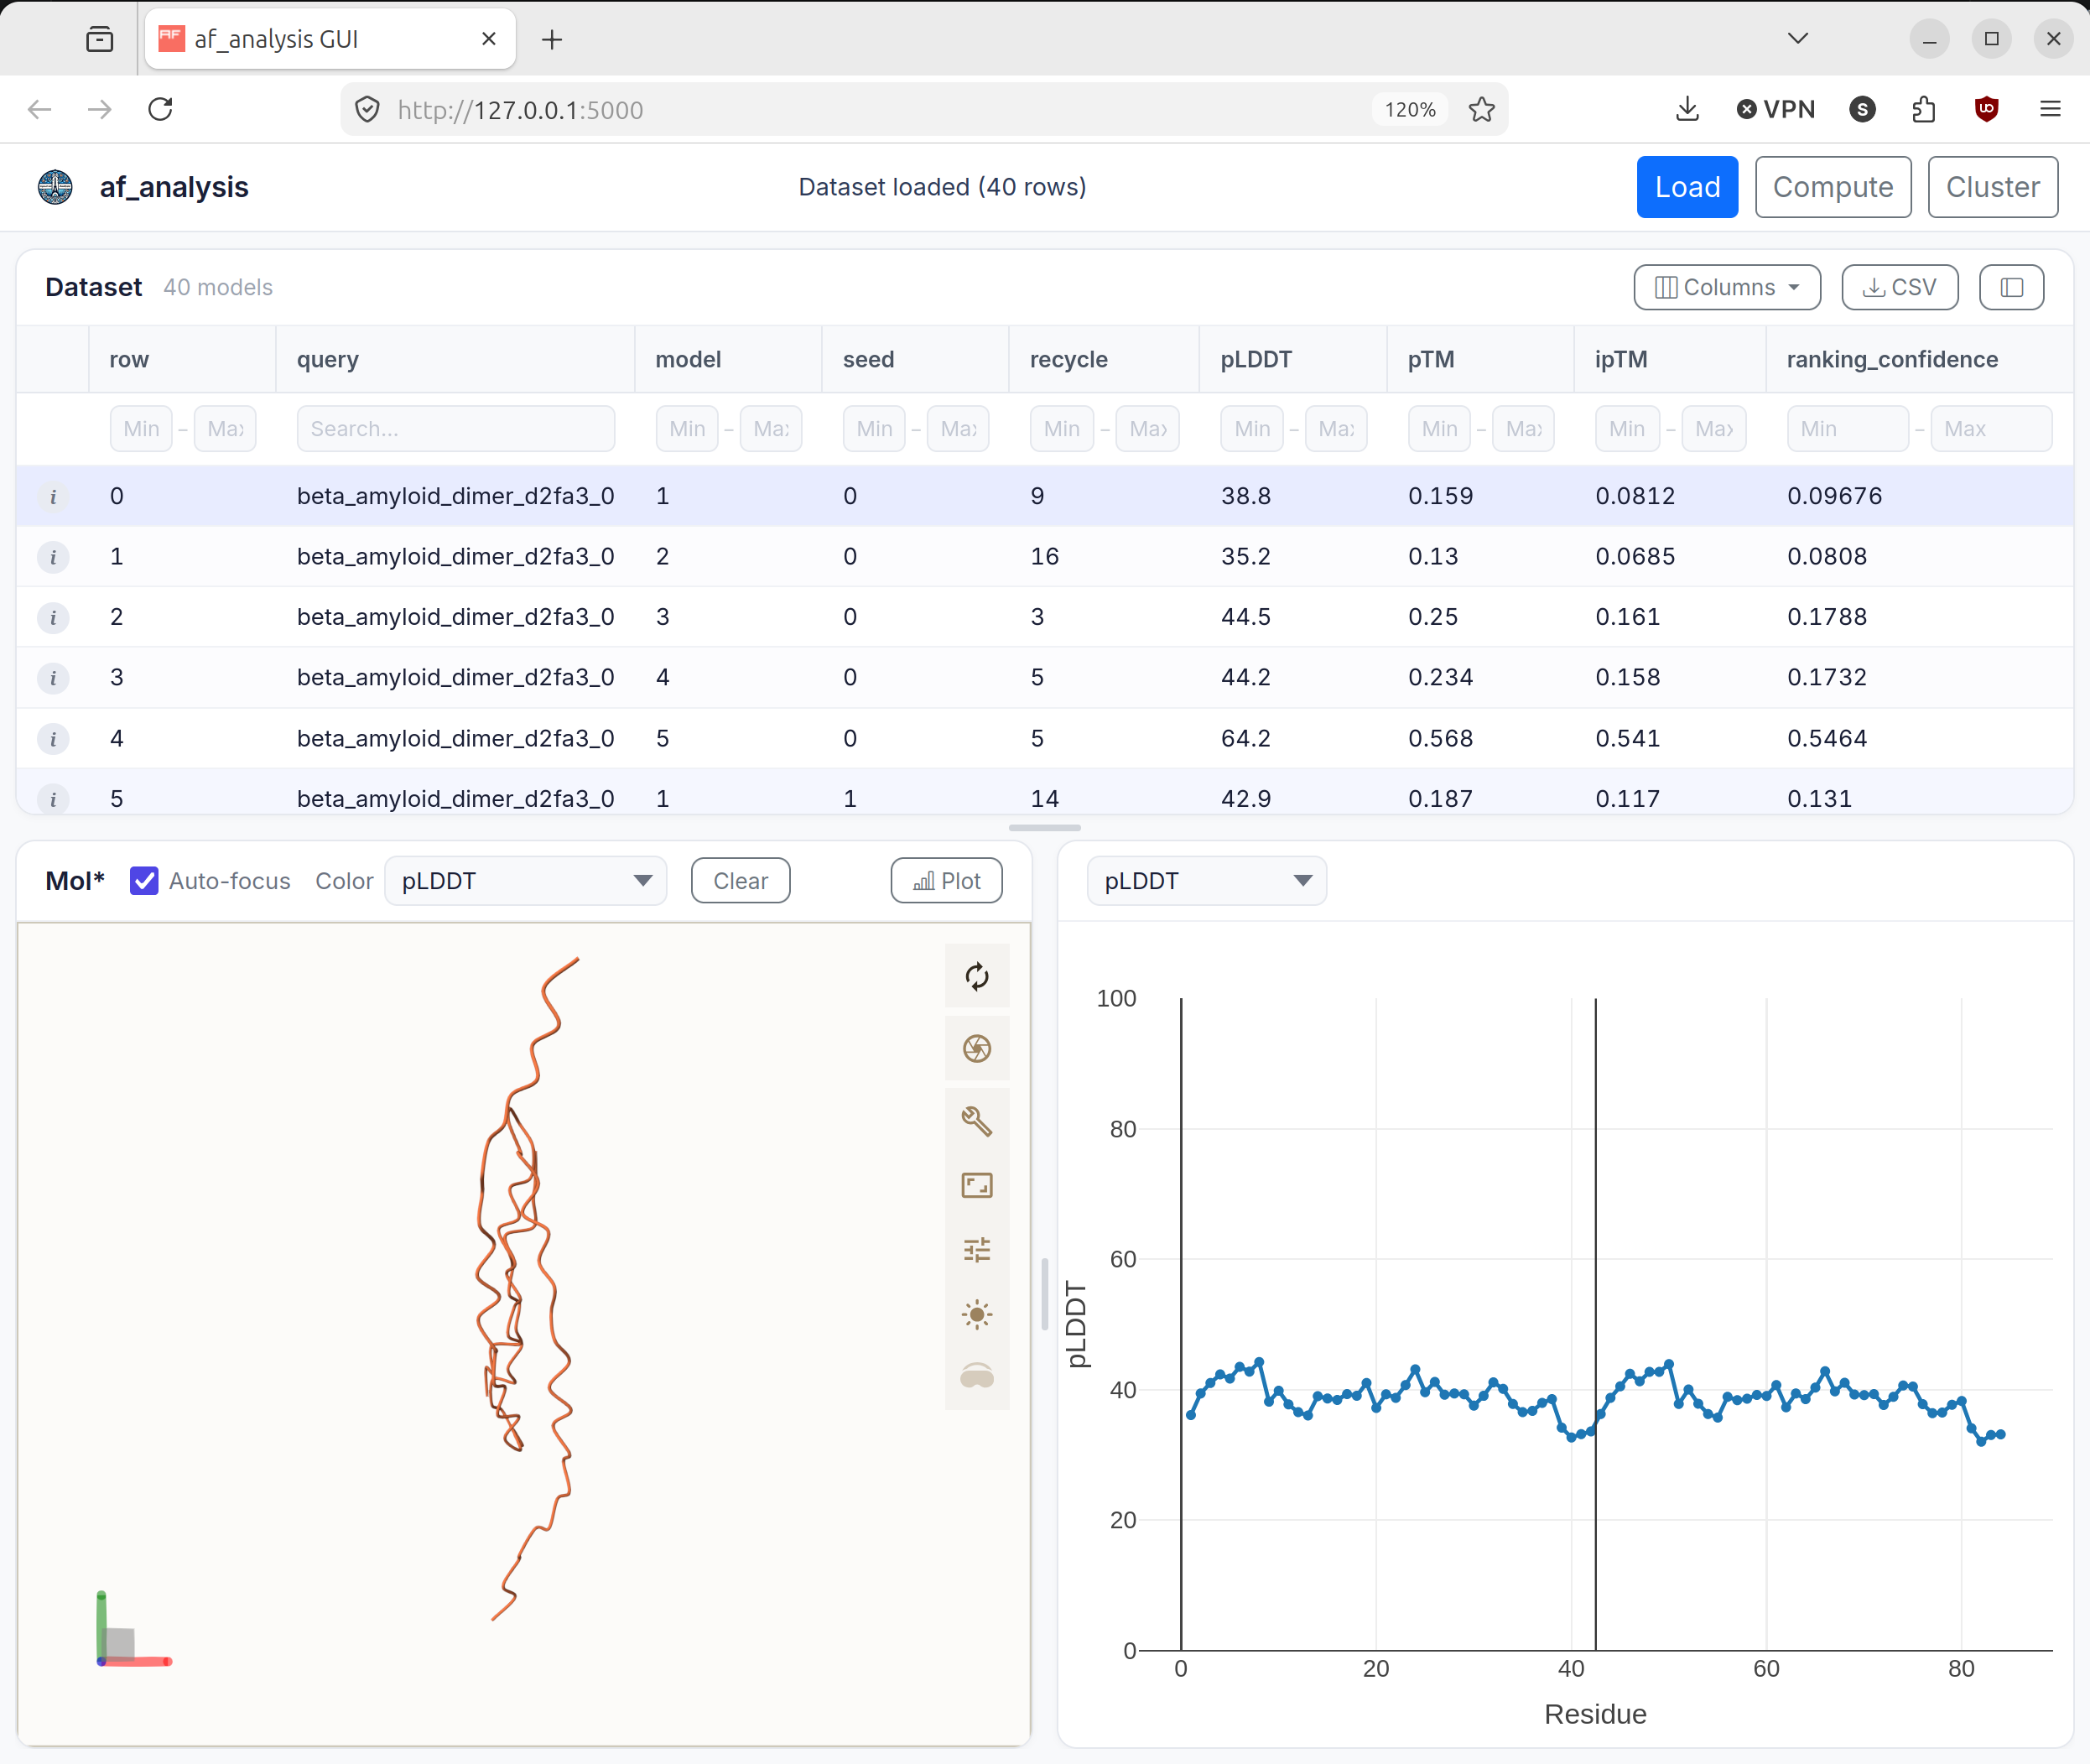
A loaded dataset with a selected model displayed in the viewer and plot panel.
Compute additional metrics when the current dataset does not yet contain
pdockq2,LIS,LIA,ipTM_d0, oripSAEvalues.
The score computation dialog for adding derived metrics to the loaded dataset.
Run clustering to generate MDS coordinates, cluster labels, dendrogram data, and superposed multi-model views.
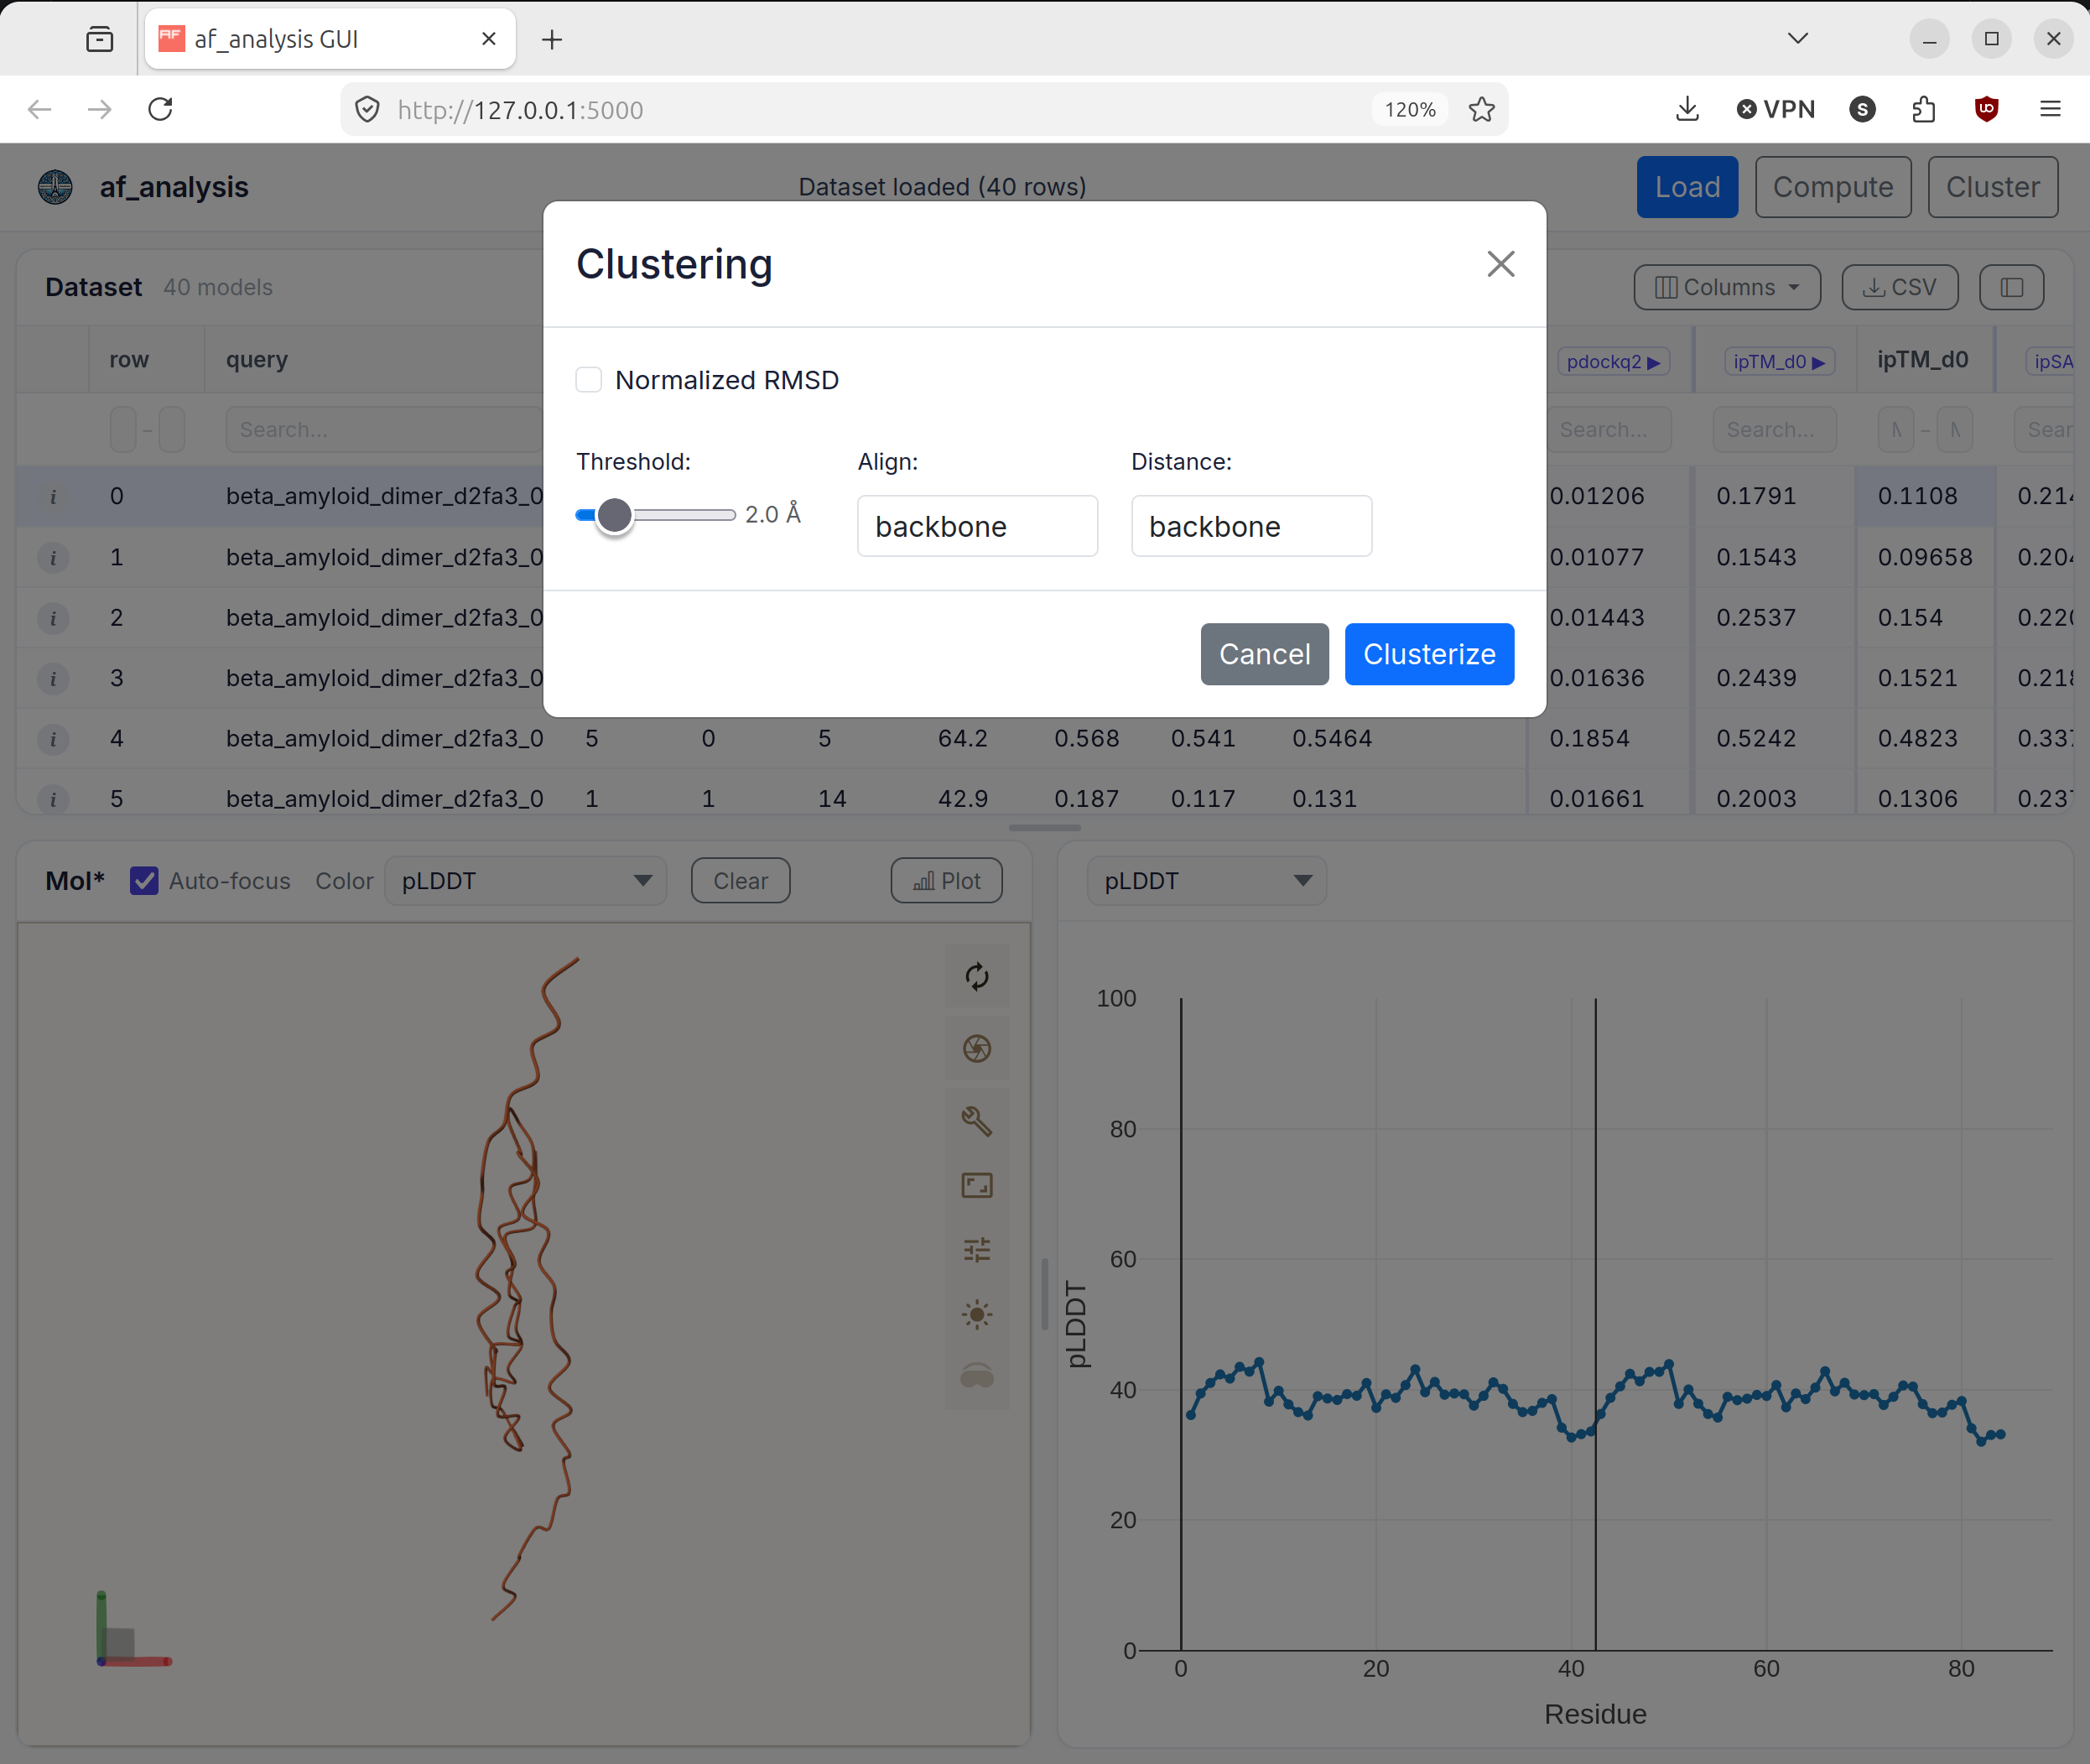
The clustering dialog used to configure and run hierarchical clustering.
Supported Inputs
The load dialog accepts either:
A directory containing AlphaFold results readable by
af_analysis.Data.A CSV file previously exported from the library or from the GUI.
The format selector exposes the formats supported by the current GUI implementation:
autodefaultcolabfold_1.5AF3_localAF3_webserveralphapulldownalphapulldown_fullboltz1chai1massivefoldfull_massivefold
GUI Features
Dataset table
The table is populated from the loaded Data.df dataframe. The interface keeps identifier columns such as query, model, and seed visible when they exist, and it can export the current table as CSV.
Structure viewer
The Mol* panel loads the structure corresponding to the selected row and supports multiple coloring schemes, including pLDDT, chain ID, cluster label, secondary structure, sequence ID, and element type.
Plots
The plot panel can display:
Per-residue pLDDT curves.
PAE matrices.
LIS and cLIS matrices when those scores are present.
ipTM_d0andipSAEmatrices when they have been computed.MDS scatter plots and dendrograms after clustering.
Computed metrics
The compute dialog exposes three analysis actions from af_analysis.analysis:
pdockq2LIS_LIAwith configurable PAE and distance cutoffsiptm_d0together withipSAEwith a configurable PAE cutoff
Clustering
The clustering dialog runs hierarchical clustering on the loaded dataset with configurable threshold, alignment selection, distance selection, and optional RMSD normalization. The GUI stores the resulting universes so selected clustered frames can also be returned as an already superposed multi-model PDB.
Command-Line Usage
The af_analysis_gui command accepts an optional dataset path and three flags:
Argument |
Description |
|---|---|
|
Optional path to a result directory or CSV file to load immediately at startup. |
|
Host interface to bind. The default is |
|
Preferred port. The default is |
|
Force a specific input format instead of using auto-detection. |
HTTP API
The browser interface is backed by a small JSON API implemented in af_analysis_gui.flask_app.
Endpoint |
Method |
Purpose |
|---|---|---|
|
|
Load a dataset from a directory or CSV file. |
|
|
Browse directories and CSV files from the local filesystem. |
|
|
Retrieve visible table data and the full content of a selected row. |
|
|
Return residue-level confidence values and PAE matrices. |
|
|
Return computed pairwise score matrices when present. |
|
|
Return the selected PDB or mmCIF structure text for Mol*. |
|
|
Run score calculations on the loaded dataset. |
|
|
Run hierarchical clustering and expose MDS and dendrogram results. |
|
|
Return a superposed multi-model PDB for selected clustered rows. |
|
|
Stream progress updates as server-sent events. |
|
|
Export the current dataset or report application state. |
API Reference
af_analysis_gui package
GUI module for af_analysis.